Customizing the Python Debugger
| 9 minutes
I’ve used several IDEs over the years (Visual Studio, Eclipse, MonoDevelop, XCode - I kinda regret that last one), but when I started working with Python, I made the decision to use VSCode only as a text editor on steroids, doing everything else inside the terminal. That means I never use VSCode’s python debugger, preferring pdb-ish packages like pdbpp.
However, I’ve always wondered exactly how they work, as normally those tools retain all of the original pdb functionalities while enhancing the experience with all sorts of cool stuff. I did some digging and in this post I’ll explain how to create a tiny pdb-ish implementation, adding a simple command to print how much memory is being used by the args of the current function.
All source code created for this post can be found here.
Basics
One of the most basic things a young python developer will learn is how to put a breakpoint in the source code. For python < 3.7, the most common way to do this is with import pdb; pdb.set_trace. Those commands will import the standard pdb module and call function set_trace(), which will throw you into python’s debugger as soon as you code hits that line. If you decide to use an alternative debugger like pudb or ipdb, you’ll have to adjust that command slightly, since the module/function you’ll import will probably be different (e.g. import ipdb; ipdb.set_trace()).
Luckily, versions >= 3.7 provide the breakpoint() built-in function, which has support for non-standard debugging tools as described in PEP 553. This means it’s possible to control breakpoint()’s behavior via environment variables, instead of having to use a completely different command in case you decide to switch debuggers. I won’t use breakpoint() in this post to simplify the explanation (I haven’t yet seen much people using this in the wild), but everything in here supports breakpoint() as long as the env var is correctly set up.
Going back to pdb, turns out set_trace is just a simplified interface for the Pdb class, as we can see in pdb’s source code. The docs will also state that all pdb’s functionality is defined inside the Pdb class, making the code extensible by nature.
What’s interesting about the Pdb class is that it implements two other classes Bdb and Cmd (as if we didn’t already have enough acronyms). Bdb is python’s debugger framework that provides basic capabilities like setting breakpoints; Cmd is a framework for writing line-oriented command interpreters. This means you don’t necessarily need to inherit from Pdb if you want to create your custom debugger - you can do all the heavy lifting yourself using Bdb and Cmd. This is not the aim of this post though, we’ll just extend Pdb’s functionalities into our own tiny custom debugger module.
Overriding the prompt
Let’s start with a very simple example: overriding the default (Pdb) prompt. We’ll need two new python files: dummy.py, a dummy script for breakpoints and debug.py, which will host our new debugger. Here are the contents of my dummy.py:
from random import random


def print_the_things(number: int, text: str, big_list: list):
    import pdb; pdb.set_trace()

    print(f"Number: {number}, Text: {text}, List: {big_list}")


print_the_things(
    number=10,
    text="Blame and lies, contradictions arise",
    big_list=[random() for _ in range(100000)]
)
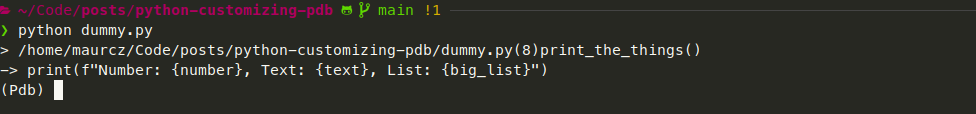
We’ll hit the breakpoint only once as soon as we enter the function. This is the prompt I’m getting:
To customize the prompt, we’ll need to create a new class that inherits Pdb and changes one of the inherited properties during initialization. Here’s the code of debug.py:
import pdb
import sys


class Debug(pdb.Pdb):
    def __init__(self, *args, **kwargs):
        super(Debug, self).__init__(*args, **kwargs)
        self.prompt = "[extended-pdb] "


def stop():
    debugger = Debug()
    debugger.set_trace(sys._getframe().f_back)
What’s going on with that code?
- The
__init__function will callPdb’s initializer throughsuper(). We must do this before our prompt customization, asPdbinitializesself.promptwith'(Pdb) '(source) - A line setting
self.promptto whatever we want stop()is a simplified interface to our custom debugger, analogous topdb.set_trace().
Now we need to import our custom debugger inside dummy.py, calling our custom breakpoint function. Here’s the modified code:
from random import random


def print_the_things(number: int, text: str, big_list: list):
    import debug; debug.stop()  # custom breakpoint

    print(f"Number: {number}, Text: {text}, List: {big_list}")


print_the_things(
    number=10,
    text="Blame and lies, contradictions arise",
    big_list=[random() for _ in range(100000)]
)
Now if we run our dummy script…
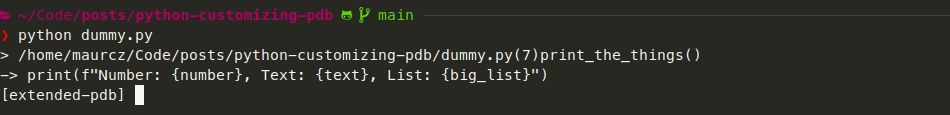
… we get a custom prompt! What’s cool about this structure is that this custom debugger will retain all of pdb’s capabilities. You’ll still have n, s, r and everything else.
Building a custom command
Now that we got the basic structure going, we can push a bit more by creating a new command to our custom debugger.
Earlier I’ve mentioned that Pdb is built on top of other two classes, one of them being Cmd. This class dictates how commands should be implemented to be recognized when an user enters the command on a debugging session. The structure is pretty simple: if your debugger class inherits Cmd and has a do_something method, something becomes a new command you can use in the debugger. Since we’re extending Pdb, which in turn implements Cmd, we’ll also have to follow the name convention.
For reference, this link shows how Pdb implements the long list command. Notice how it has a “shortcut” for long list called ll, created by referencing the original method: do_ll = do_longlist:
# Code from https://github.com/python/cpython/blob/3.8/Lib/pdb.py#L1265, added here for reference only.
# Copied on May/2021 - currently implementation might be different.

(...)

def do_longlist(self, arg):
    """longlist | ll
    List the whole source code for the current function or frame.
    """
    filename = self.curframe.f_code.co_filename
    breaklist = self.get_file_breaks(filename)
    try:
        lines, lineno = getsourcelines(self.curframe)
    except OSError as err:
        self.error(err)
        return
    self._print_lines(lines, lineno, breaklist, self.curframe)
do_ll = do_longlist


(...)
The name of our custom command will be args_memory_usage, and the intent is to print inside the debugging session how much memory the args of the current function are consuming. The sys module has a function called getsizeof that could have been used for that, but while doing some research, I found that it won’t really be that precise in all cases. Fortunately, there’s a really small dependency we can use for more accurate consumption stats called Pympler.
I also wanted to make sure we’re not just throwing bytes numbers at the user by default, as those can be a bit hard to understand for heavy objects. I wrote a pretty basic bytes/kb/mb convertor (I’m using 1000 as base and I’ll save yourself from all the discussions about 1000 vs 1024, SI, kibibytes, mebibytes and more), which will also be used to show how to pass args to custom commands.
Here’s our revamped debug.py:
| |
Where did all that code inside do_args_memory_usage come from?
Well, pdb already has a pretty good implementation for a command that will print all the args of the current function (a). It gets the function args according to the current state of the debugger and prints them one by one. The arg parameter from do_args_memory_usage is the string that’s entered after the command inside the debugging session (e.g. for amu mb, arg would be mb).
Aside from the name of the function (and the shorthand do_amu in line 46), the only changes I had to make were lines 41 and 42, where I get the size in bytes of the variable and apply the format according to the user input.
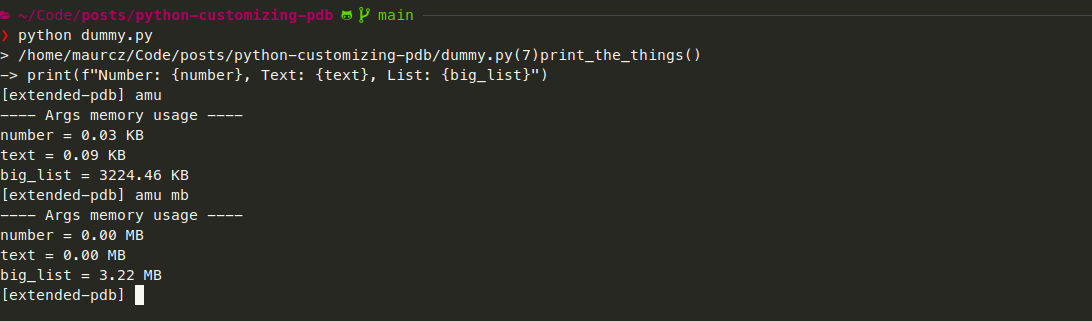
The formatter function is extremely simple and has lots of room for improvement (constants, error handling, better formatting …), but providing a perfect implementation is beyond the scope of this post. The command should now be good enough to show basic consumption for function args. Let’s check how that looks in the terminal:
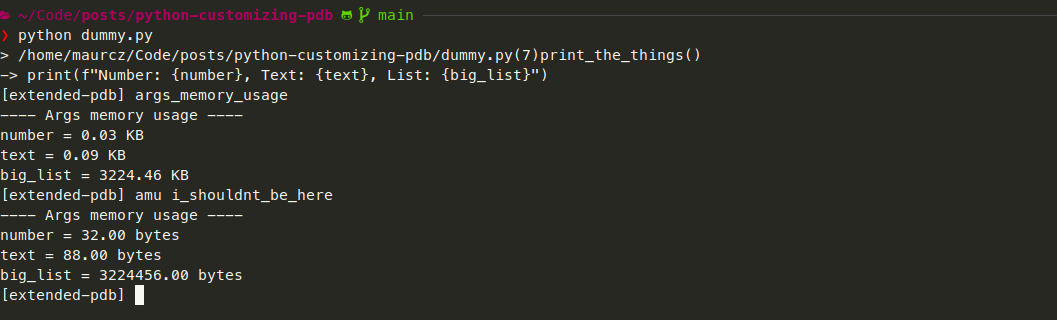
This next pic shows the long version of the command and the fallback to BYTES:
Aaand now we have a brand new command built on top of Pdb! You can follow this same pattern to extend any commands you want from regular Pdb - the source code of the pdb module is not that hard to understand and the pattern above applies to any other new commands you might create.
One caveat
Something to be aware of when playing with these customizations is that any custom debugger will have to be manually installed for any new virtual/conda environments. This means you’ll have to wrap your custom debugger in a package with setup.py and the likes, to make a custom debugger functional in the wild.
Currently I’m a heavy user of pdbpp and conda environments, so I have an alias in my .bashrc to install the debugger for every new conda environment I create. Beware that any dependencies that might come with your custom debugger might impact other dependencies in your current environment. Personally I never had any issues, but dependency conflicts are always a possibility.
Next steps
The two main reasons I became a user of pdbpp are the built-in support to themes through Pygments and the sticky mode, which helps me with not getting totally lost while debugging. Before writing this post I had no idea how easy it was to create basic extensions to pdb, so I’m tempted so spend some time trying to make my own implementations of those features, for learning purposes. But not today - the avalanche of acronyms in this post kinda made my head hurt a bit. Hopefully that wasn’t the case for you.
I hope you enjoyed the post, see you in the next one!
Tech summary
- Language: Python
- Main module:
pdb - Dependencies: Pympler